
Power BI for Working Professionals: A Complete Guide to Building Job-Ready Data Analytics Skills
Power BI is not just a dashboard tool. For a working professional, it can become a practical way to reduce repetitive reporting, understand business data better and communicate insights with more confidence.
This complete guide covers the skills you should actually learn, the order in which you should learn them, the projects you can build, common mistakes to avoid and how to move from watching tutorials to solving real business problems.
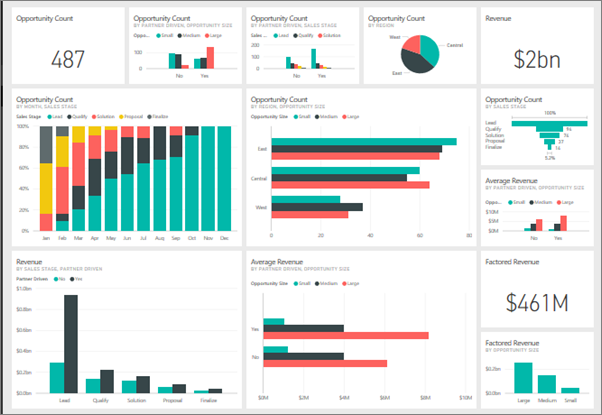
What you will learn in this guide
- What Power BI is and why it matters for working professionals
- Who can learn Power BI
- Excel vs Power BI
- Power Query and data cleaning
- Data modelling and relationships
- DAX fundamentals and advanced concepts
- Dashboard design and Power BI Service
- Five practical portfolio projects
- Common mistakes beginners make
- How to build a Power BI portfolio
- A practical learning roadmap
- Frequently asked questions
Why Power BI matters for working professionals
If you work in finance, sales, HR, operations, marketing, supply chain, MIS or another business function, chances are you already work with data every day.
The problem usually is not access to data. The problem is what happens after you receive it.
You download an Excel file. Another team sends you a second report. You clean columns manually, copy data between sheets, update formulas, create pivot tables, prepare charts and finally send the report to your manager. Then next week or next month, you repeat almost the same process again.
This is one of the areas where Power BI can significantly improve the way a working professional handles reporting and analysis.
Power BI gives you a workflow for connecting data, cleaning it, creating relationships, performing calculations, visualising results and sharing insights. Learning to create a few charts is relatively easy. Learning how to take an unfamiliar business problem and turn raw data into a reliable analytical solution is the skill that actually matters.
What is Power BI?
Power BI is Microsoft’s business intelligence and data visualisation platform. It allows you to connect to multiple data sources and transform raw information into interactive reports and dashboards.
A useful way to understand the complete workflow is:
Raw data → Data cleaning → Data modelling → Calculations → Visualisation → Insights → Sharing
Every stage requires a different skill. Imagine a sales manager asking which region generated the highest revenue, which products are growing, which salespeople are behind target, how this month compares with last month and which customers contribute the most revenue.
The final dashboard is only the visible layer. Before you create it, you must understand the source data, clean inconsistencies, establish relationships between tables, create correct calculations and decide how the information should be presented.
That is why learning Power BI properly involves much more than learning charts.
For structured learning and one-to-one support, you can also explore Data Drishti’s Power BI training for working professionals.
Who can learn Power BI?
Power BI is not only for people with a technical background. Professionals from many functions can use it because the core problem Power BI solves is common across organisations: turning data into information that helps people make decisions.
Finance professionals
Power BI can be used to analyse revenue, expenses, profitability, budgets, variance, cash-flow trends and financial performance across departments or business units.
Sales professionals
Sales teams can analyse targets, regional performance, product contribution, customer value, salesperson performance and month-on-month or year-on-year growth.
HR professionals
HR teams can build reports around headcount, hiring, attrition, employee demographics, workforce trends, compensation and departmental movement.
Operations professionals
Power BI can help operations teams monitor turnaround time, productivity, SLA achievement, order fulfilment, quality indicators and other operational KPIs.
Marketing professionals
Marketing data from campaigns, leads, acquisition channels, website activity and conversions can be brought together to create more structured performance reporting.
MIS and reporting professionals
People already managing recurring Excel reports often find Power BI especially useful because repetitive processes can be converted into refreshable and reusable reporting workflows.
The objective does not always have to be becoming a full-time data analyst. For many professionals, the first goal is simply to become much better at using data in their current role.
Excel vs Power BI: Do you need to stop using Excel?
No. Power BI does not make Excel irrelevant. In many organisations, both tools work together.
Excel remains excellent for quick calculations, small ad-hoc analysis, flexible spreadsheet work and manual investigation. Power BI becomes especially valuable when reporting is recurring, data comes from several sources, relationships between tables matter or management needs interactive dashboards.
| Situation | Excel | Power BI |
|---|---|---|
| Quick calculations | Excellent | Possible |
| Small ad-hoc analysis | Excellent | Good |
| Recurring dashboards | Can become manual | Strong |
| Multiple related tables | Can get complex | Designed for it |
| Interactive reporting | Limited | Strong |
| Advanced data modelling | Limited | Strong |
| Sharing dashboards | Usually file-based | Power BI Service |
The better question is not “Should I use Excel or Power BI?” It is “Which tool is more appropriate for the reporting problem I am trying to solve?”
Step 1: Learn Power Query for data cleaning
Real-world data is rarely clean. You may encounter blank values, duplicate records, incorrect data types, inconsistent naming, multiple date formats, unnecessary columns and data spread across several files.
Power Query helps you import, clean and transform data before analysis. Instead of repeating the same cleaning steps manually every month, you can define the transformation process once and refresh it when new data arrives.
This is one of the most practical skills for working professionals because it directly reduces repetitive reporting work.
Typical Power Query tasks
- Remove duplicates
- Replace or clean values
- Split and merge columns
- Change data types
- Append monthly files
- Merge datasets
- Create reusable transformation steps
Example: If you receive 12 monthly sales files, Power Query can help combine them into one structured dataset rather than manually copying each file into a master sheet.
Step 2: Understand data modelling
Data modelling is one of the areas beginners often skip. They import all their data and immediately begin creating visuals. That can work for a small demo, but it becomes unreliable as reports grow.
Imagine you have a sales table containing Order ID, Product ID, Customer ID, Date and Revenue. You also have separate Product, Customer and Date tables. Power BI needs to understand how those tables relate to each other.
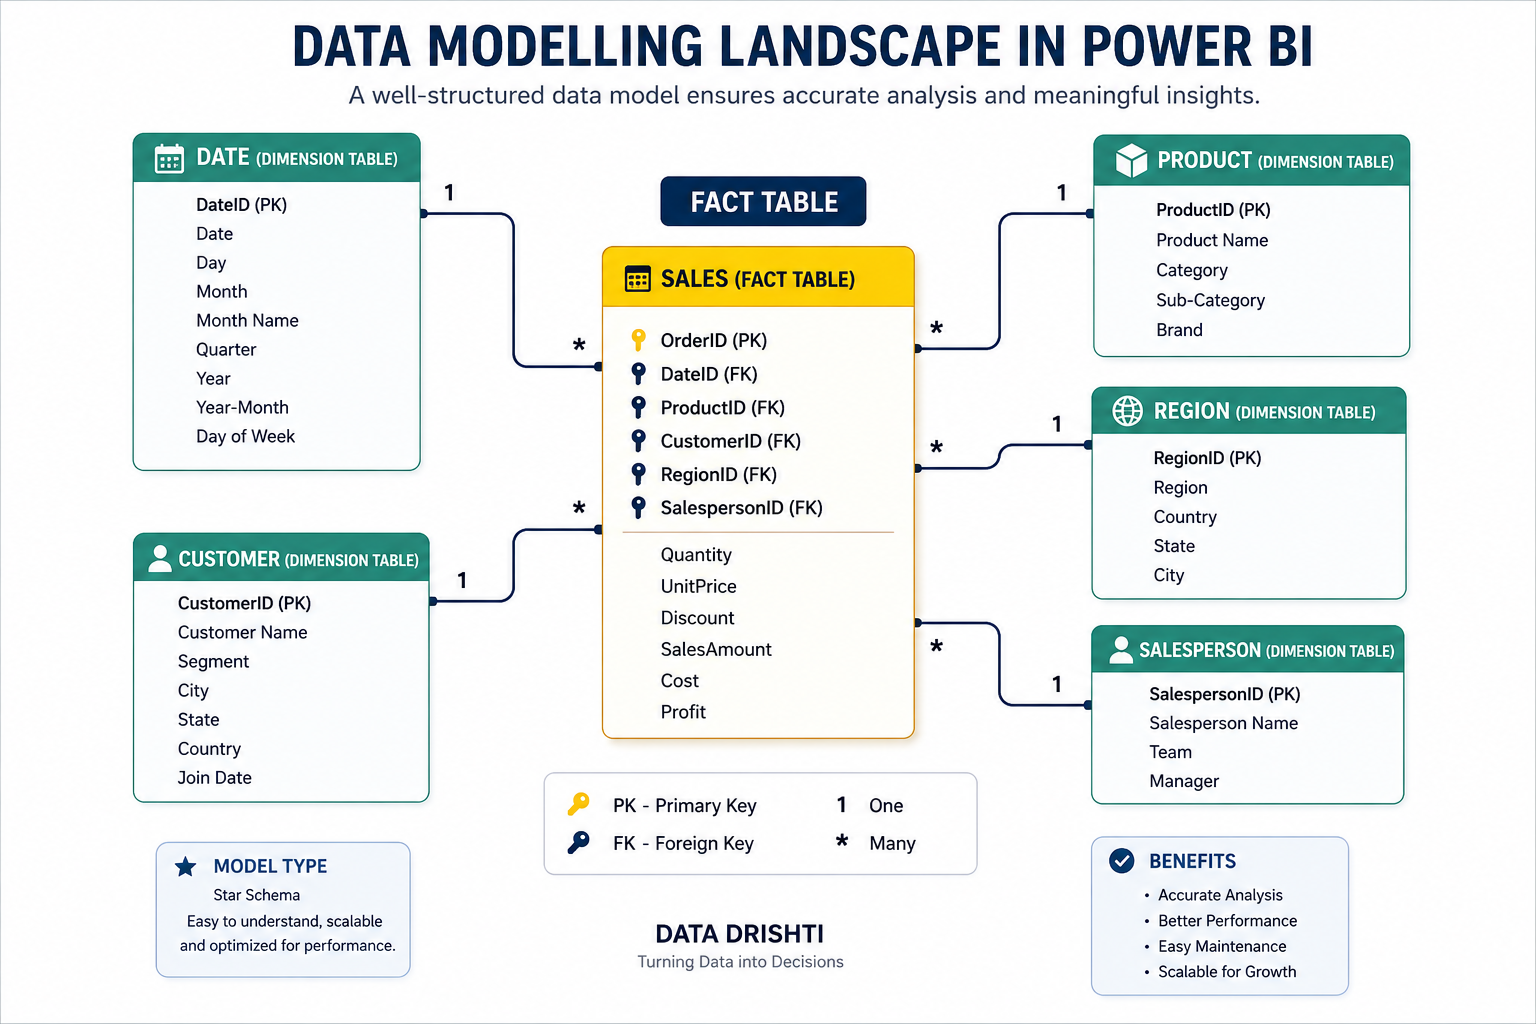
Instead of putting everything into one large table, a well-designed model usually separates transactional information from descriptive information.
Important concepts to learn include:
- One-to-many relationships
- Fact tables
- Dimension tables
- Star schema
- Cardinality
- Filter direction
- Date tables
A beautiful dashboard built on a poor data model can still produce incorrect numbers. That is why modelling should be treated as a foundation, not an optional advanced topic.
Step 3: Learn DAX properly
DAX stands for Data Analysis Expressions. It is the formula language used in Power BI for calculations.
At first, you may create simple measures such as total sales, total orders or average order value. As your skills improve, you can move into calculations such as profit margin, year-to-date sales, previous month revenue, year-over-year growth, running totals and dynamic rankings.
The goal is not to memorise hundreds of DAX functions. The goal is to understand how calculations behave within your data model.
Start with these DAX concepts
- Measures vs calculated columns
- SUM
- COUNT
- DISTINCTCOUNT
- DIVIDE
- IF
- CALCULATE
- FILTER
Then move into
- Filter context
- Row context
- Variables
- Time intelligence
- ALL and related filter functions
- Ranking
- Dynamic calculations
For working professionals, the important shift happens when DAX stops being a list of formulas and becomes a way to represent actual business logic.
Learning Power BI but getting stuck while implementing?
Watching a tutorial and solving a completely new business problem are two different experiences. If you understand concepts while watching but struggle when you have to build independently, structured guidance can help close that gap.
Data Drishti focuses on Power BI learning for working professionals with one-to-one guidance and practical implementation.
Step 4: Learn dashboard design
Once the calculations are correct, the next challenge is communication.
A common beginner mistake is trying to add as many visuals as possible. More charts do not automatically create a better dashboard.
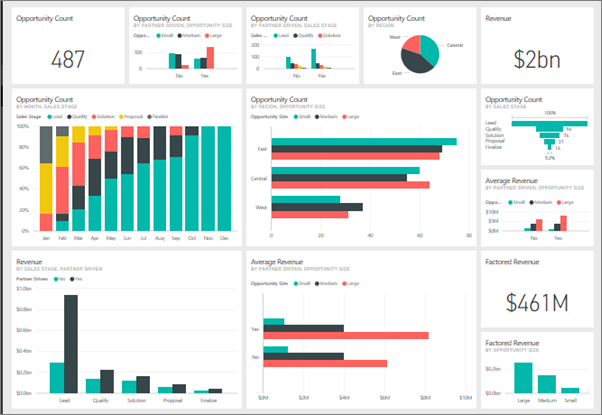
Start by asking what the user needs to understand first. For a sales dashboard, the hierarchy could be revenue, growth, target achievement, regional performance, product performance and customer contribution.
The design should guide the viewer through the story instead of forcing them to search for the important information.
Useful dashboard elements
- KPI cards
- Bar and column charts
- Line charts
- Tables and matrices
- Slicers
- Drill-through pages
- Tooltips
- Conditional formatting
The best visual is not the most impressive-looking chart. It is the chart that helps the viewer understand the answer quickly.
Step 5: Learn Power BI Service
Building a Power BI Desktop file is not the end of the workflow. In a real organisation, reports need to reach other people and stay updated.
Power BI Service is where publishing, collaboration, refresh and access management become important.
- Publishing reports
- Workspaces
- Scheduled refresh
- Apps
- Sharing
- Permissions
- Row-level security
- Collaboration and governance
Understanding these concepts helps you move from creating a report for yourself to building a reporting solution that can actually be used by a team.
Five Power BI projects working professionals can build
Theory is useful, but projects force you to connect multiple concepts at the same time. A good portfolio should demonstrate that you can move from raw data to a useful business output.
Project 1: Sales Performance Dashboard
Build a dashboard that answers questions such as total revenue, revenue trend, top products, regional performance, target achievement and customer contribution.
Skills demonstrated: Power Query, data modelling, DAX, KPI design, visualisation and business analysis.
Project 2: Financial Analysis Dashboard
Analyse revenue, expenses, profit, profit margin, budget vs actual, monthly trends and department-level performance. This project is particularly useful for finance and accounting professionals.
Project 3: HR Analytics Dashboard
Build analysis around total employees, hiring, attrition, department distribution, tenure, salary distribution and workforce demographics.
Project 4: Supply Chain Dashboard
Track inventory, suppliers, order fulfilment, delivery performance, product movement, stock availability and lead times.
Project 5: Customer Analysis Dashboard
Analyse customer acquisition, repeat customers, revenue contribution, segments, geographic distribution and purchase behaviour.
You can learn more about practical Power BI training and project-focused learning at datadrishti.in.
Do not just build projects. Learn to explain them.
Imagine an interviewer opens your portfolio and asks, “Walk me through this dashboard.” Saying that you created a few charts in Power BI is not enough.
You should be able to explain:
- What was the business problem?
- What data did you receive?
- What cleaning did you perform?
- How did you model the data?
- Which measures did you create?
- Why did you choose those visuals?
- What insights did you discover?
- What business action could be taken?
This is what turns a dashboard from a practice exercise into a portfolio project.
Why watching Power BI tutorials is not always enough
YouTube and recorded courses can be excellent resources. The challenge appears when learning becomes a cycle of watch, copy, finish and forget.
You follow somebody else’s dataset. You copy their DAX. Your dashboard works. Then you receive a completely different dataset at work and do not know where to begin.
That is the gap between following instructions and solving problems independently.
A stronger learning cycle looks like this:
Learn → Attempt → Get stuck → Understand why → Correct → Rebuild → Apply independently
If your biggest difficulty is implementation rather than exposure to content, one-to-one mentorship can be more useful than adding yet another recorded course to your library.
Common mistakes beginners make while learning Power BI
1. Focusing only on visuals
A dashboard can look polished and still contain incorrect calculations. Learn data modelling and DAX before obsessing over design.
2. Memorising DAX
Understanding context is more important than memorising dozens of functions. Learn why a measure works, not only what formula was typed.
3. Copying projects
Reference projects are useful while learning, but eventually you need to build independently with unfamiliar data.
4. Ignoring the business question
Do not begin with “Which chart should I create?” Begin with “What question are we trying to answer?”
5. Trying to learn everything before building anything
Do not spend months consuming tutorials before starting projects. Building exposes your knowledge gaps much faster.
6. Not validating numbers
A dashboard should always be checked against source data or known totals. Visuals are useful only when the underlying numbers can be trusted.
How to build a Power BI portfolio
Your portfolio should demonstrate your thinking, not only your design ability.
Problem statement
What business problem were you trying to solve?
Dataset
What information did you work with and where did it come from?
Data preparation
What transformations did you perform in Power Query?
Data model
How were the tables structured and why?
DAX
Which important measures did you create?
Dashboard
How did you organise the information and why did you choose those visuals?
Insights
What did you discover?
Recommendations
What action could a business take based on the analysis?
Three thoughtful projects can often demonstrate more capability than ten dashboards copied from tutorials.
How Power BI can help your current career
Not everybody learning Power BI needs to become a data analyst.
Consider someone working in sales operations. Their existing strengths might include sales knowledge, business understanding, Excel and stakeholder communication. Adding Power BI, data modelling, DAX and dashboarding creates a much stronger analytical profile.
The same principle applies to finance, HR, operations, marketing and supply chain.
Your domain knowledge is not something you necessarily leave behind. It can become an advantage because you already understand the business questions behind the data.
Can learning Power BI guarantee you a job?
No single tool can guarantee a job. Hiring depends on experience, role requirements, portfolio quality, communication, business understanding, interview performance, technical ability and market conditions.
Power BI should therefore be viewed as part of your professional skill set rather than a shortcut.
The stronger goal is to reach a point where you can confidently say:
“Give me a business problem and the data, and I can work towards building an analytical solution.”
That is much more meaningful than simply saying “I know Power BI.”
How long does it take to learn Power BI?
There is no universal number of days because your starting point matters. Someone already comfortable with Excel, reporting and business data may progress differently from somebody completely new to analytics.
Instead of measuring your progress only in days, ask whether you can independently import data, clean it, create relationships, write measures, validate results, design a useful dashboard, publish it and explain your analysis.
Capability is a better benchmark than calendar time.
Do you need coding experience to learn Power BI?
You do not need to be a software developer before starting Power BI.
You will gradually encounter technical concepts. DAX is a formula language, Power Query involves transformations and data modelling requires logical thinking. But these skills can be learned progressively.
For working professionals from non-technical backgrounds, the important thing is to focus on one layer at a time rather than trying to master everything at once.
A practical Power BI learning roadmap
Stage 1 — Fundamentals
Understand Power BI Desktop, reports, dashboards, datasets and the overall business intelligence workflow.
Stage 2 — Data preparation
Learn Power Query and practise cleaning messy datasets.
Stage 3 — Data modelling
Understand relationships, star schema, fact tables and dimension tables.
Stage 4 — DAX
Progress from basic measures into CALCULATE, filter context, variables and time intelligence.
Stage 5 — Dashboarding
Build interactive reports around actual business questions rather than random charts.
Stage 6 — Power BI Service
Learn publishing, refresh, permissions, security and sharing.
Stage 7 — Projects
Build several complete business projects from raw data to insights.
Stage 8 — Portfolio and interview preparation
Learn to explain your projects, modelling decisions, DAX calculations and business insights clearly.
Then repeat the cycle with increasingly difficult datasets.
When does one-to-one Power BI mentorship make sense?
Not everyone needs mentorship. If you are comfortable learning independently, troubleshooting problems and designing your own roadmap, self-learning can work extremely well.
Mentorship becomes especially useful when you repeatedly face situations such as:
- I understand the tutorial, but I cannot build it myself.
- My DAX is not working and I do not understand why.
- I do not know whether my data model is correct.
- I have built projects, but I do not know whether they are portfolio-ready.
- I need a structured roadmap that works around my job schedule.
Data Drishti trains working professionals in Power BI with one-to-one guidance focused on practical implementation.
Frequently asked questions
Is Power BI difficult to learn?
The basics are approachable. Data modelling and DAX usually require more practice because they involve understanding how data and calculations behave rather than simply learning interface features.
Can a non-technical professional learn Power BI?
Yes. You do not need to start as a programmer. Business knowledge can actually be useful because good analytics starts with understanding business questions.
Is Power BI enough to become a data analyst?
Power BI is valuable, but data analyst roles may also require Excel, SQL, statistics, business understanding and other skills depending on the organisation.
Should I learn Excel before Power BI?
Basic Excel familiarity is useful, especially if you already work with spreadsheets, but you do not need to become an advanced Excel expert before starting Power BI.
Do Power BI projects matter for interviews?
Projects can help demonstrate practical ability, particularly when you can explain the business problem, data preparation, model, calculations and insights rather than only showing the finished dashboard.
Can I learn Power BI while working full-time?
Yes. The bigger challenge is usually consistency. A structured learning plan and regular hands-on practice are more useful than consuming large amounts of content occasionally.
Ready to move from watching Power BI to actually building with it?
You do not need another folder full of saved tutorials. You need to reach the point where you can open an unfamiliar dataset and know what to do next.
Data Drishti helps working professionals learn Power BI through structured, practical guidance focused on implementation, projects, dashboards and real-world problem solving.
Explore Data Drishti and take the next step in your Power BI learning journey.